"It doesn't work." Now everyone opens a different tool
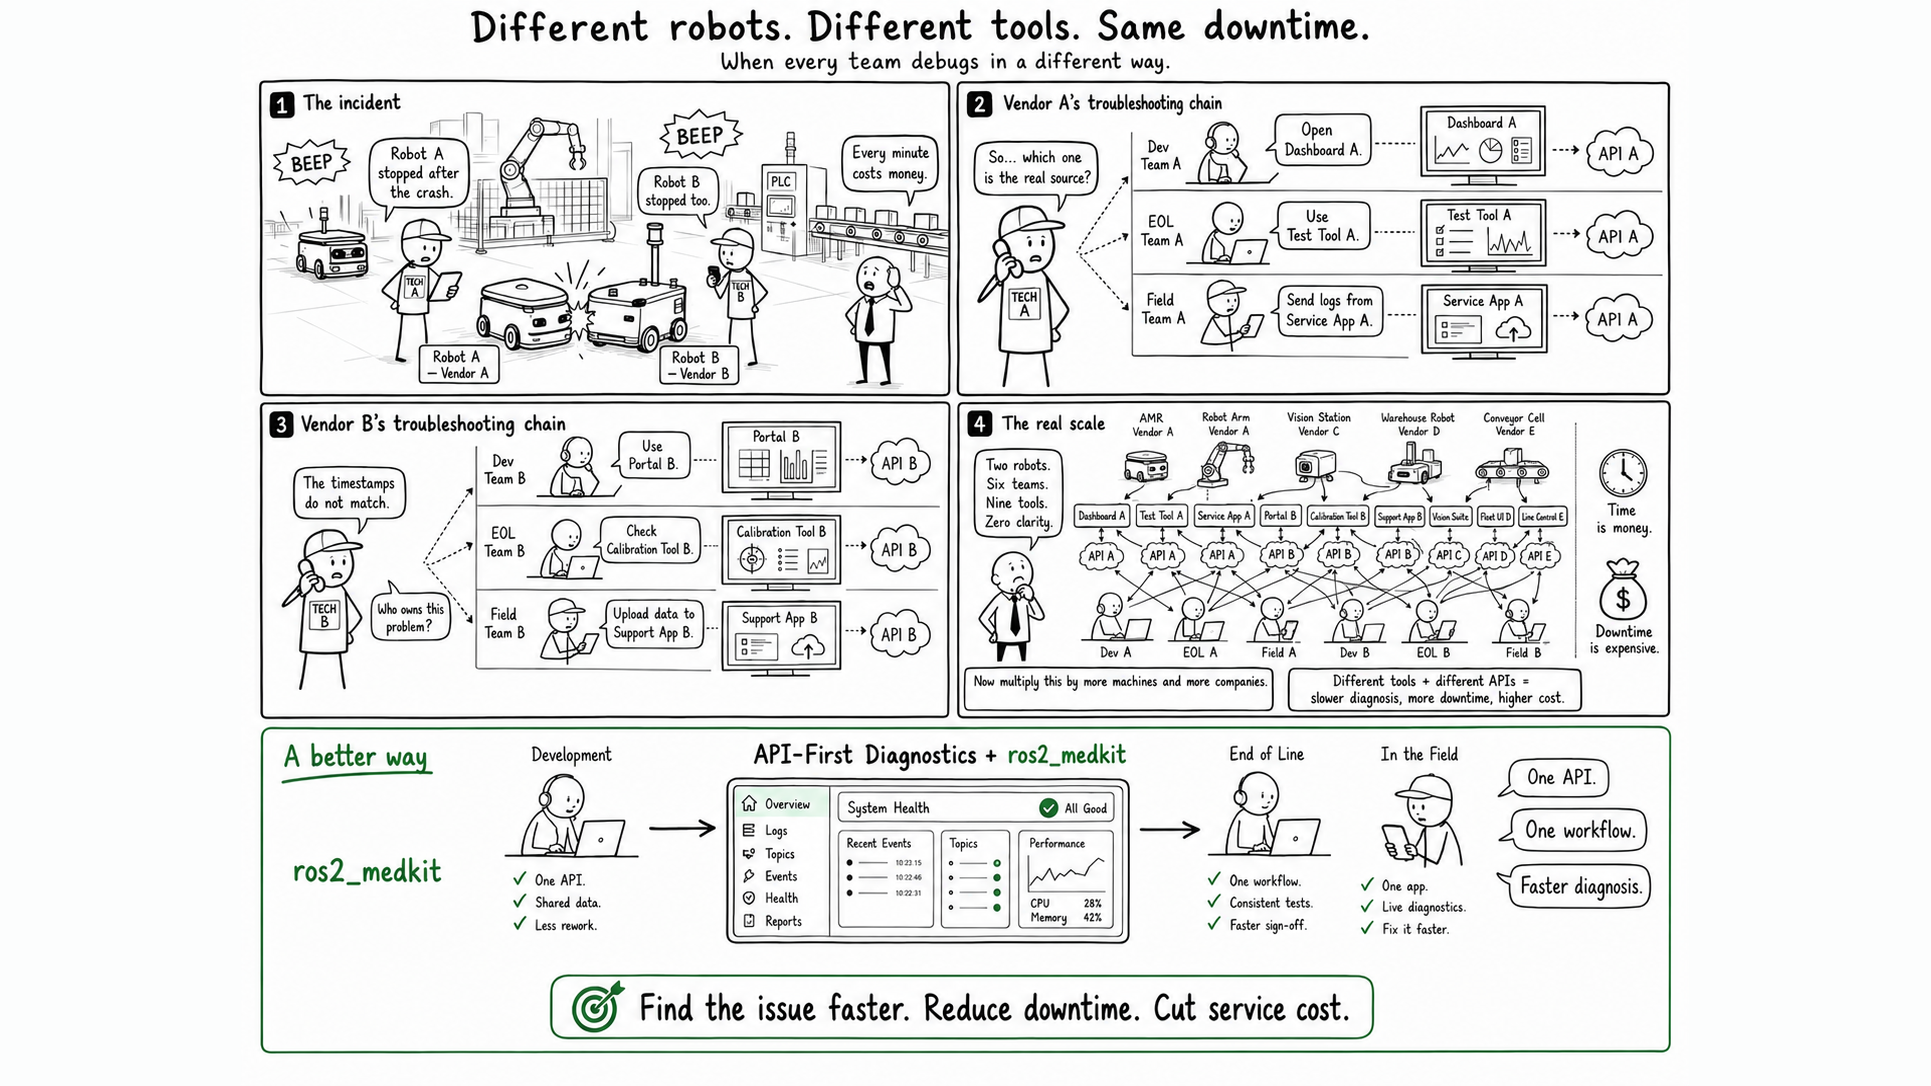
The line is down. The robotics team opens the tool that came with the AMR, the controls team opens the one that came with the PLC, and the service engineer will open a third after driving out tomorrow. Every machine on that line arrived with its own tool, its own fault codes and its own cable, and each of those tools shows a different slice of the same stoppage.
So nobody can say yet whether this is hardware or software. That question used to be easy: a machine that stopped was mechanical or electrical. In a software-defined machine the split does not hold. The same hardware ships in four variants, somebody changed a parameter at commissioning and did not write it down, an update landed last Tuesday. The motor is fine, the controller is fine, and the line is still down.
A learned component makes it harder still, because it does not fail with an exception. The process is alive, it publishes at its normal rate, and the output looks reasonable and is wrong.
Most teams have no instrument for that question, and the tools they do have multiply twice over: once for every vendor on the line, and again for every phase of the machine's life. Start with the second, because it happens even when you own one machine.
The same question, asked three times, with three different tools
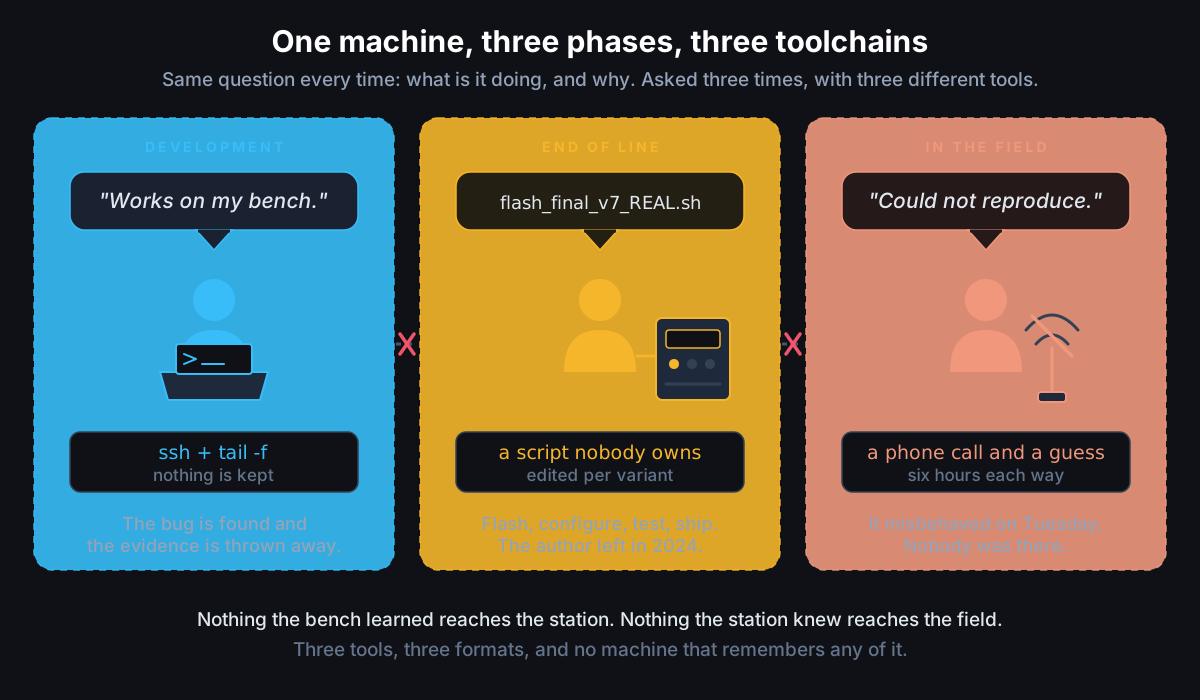
A machine is diagnosed three times in its life, by three people who never meet.
| Phase | Diagnosed today with | And then |
|---|---|---|
| Development and lab | SSH, tail -f, add a print, run it again | you find the bug and the evidence is gone |
| End of line | a flash-and-test script somebody wrote | the author left, everyone edits it per variant |
| In the field | a phone call and a site visit | nobody was there, nothing was recorded |
The bill has three lines and only the first is visible. You maintain three things instead of one. Every phase then starts its investigation from zero, because two tools recorded two different things in two formats and neither kept the state from the moment it happened. And when a unit passes at end of line and fails at the customer, nobody can say what changed: the test station and the service laptop do not share one fact about that serial number.
Then multiply it by the vendors on the line
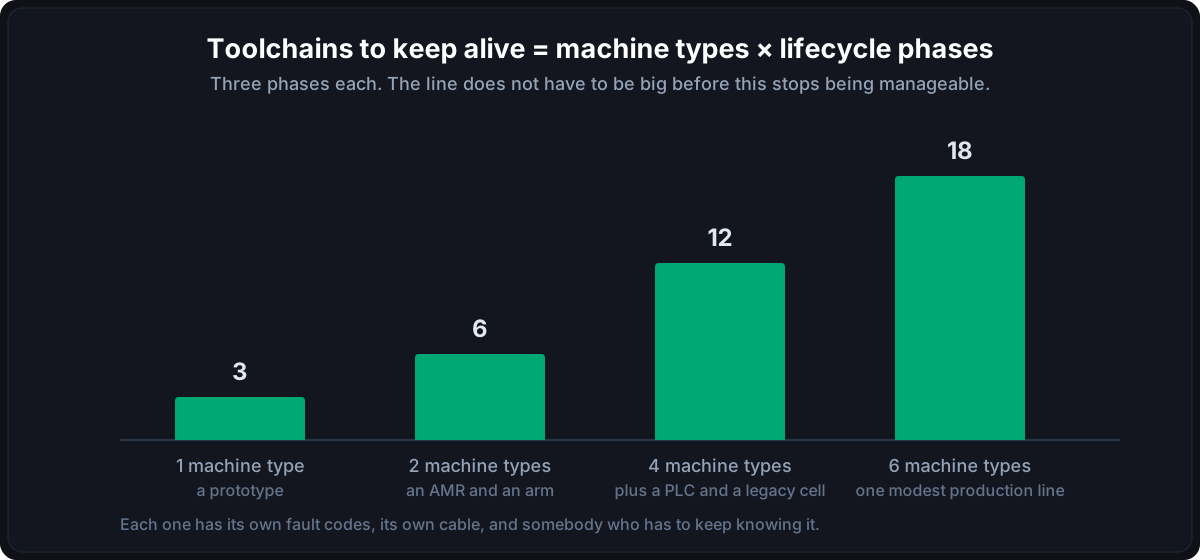
A real line has an AMR from one vendor, an arm from another, a controller that never heard of ROS, and a cell old enough that there is no graph to discover. Each arrives with its own tool, its own fault codes and its own cable, and each still has to be carried through all three phases.
Nobody buys eighteen toolchains on purpose. They arrive one machine at a time, each justified on its own. Back at the stopped line from the opening, the robotics team says it was the controller and the controls team says it was the robot, and four hours pass before anyone knows which technician to send. Nobody is being unreasonable; there is simply no shared fact to argue from.
API-first diagnostics
The answer is not a better tool for each phase, or a better tool per vendor. It is to decide the interface before the tools.
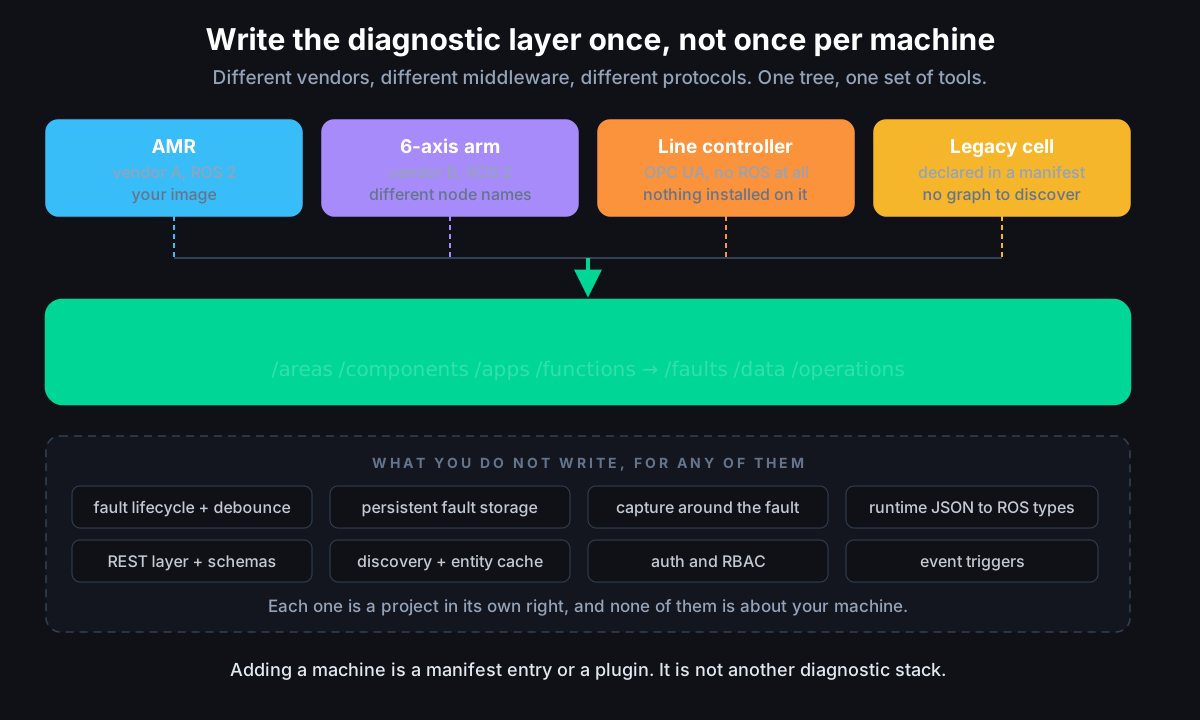
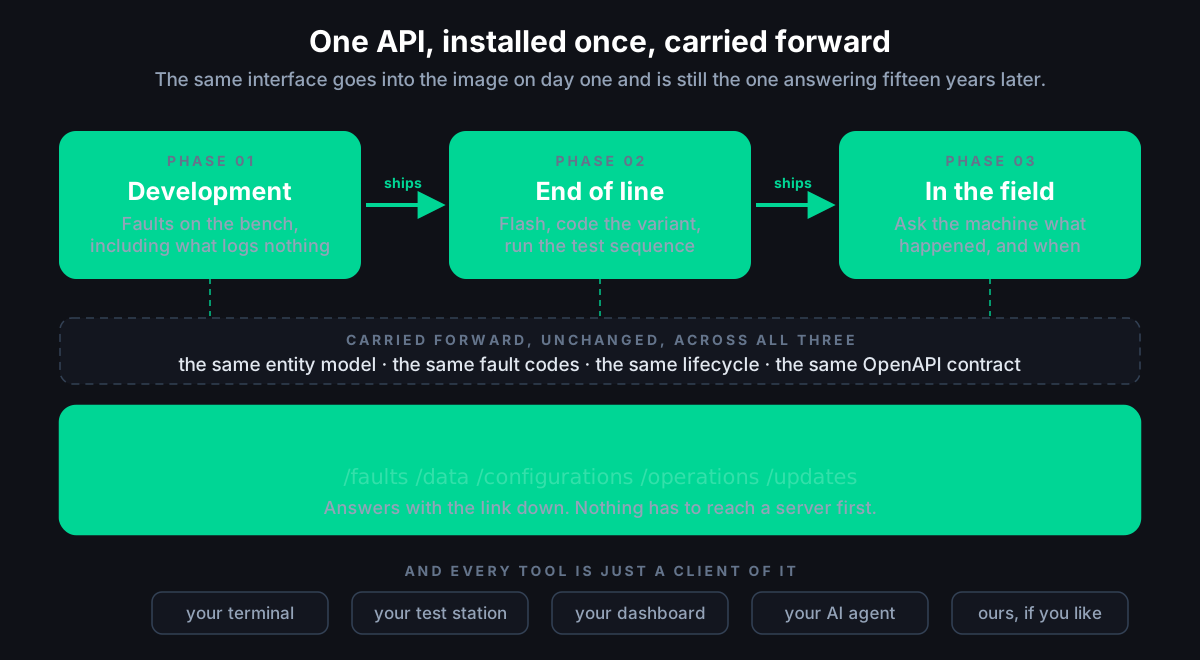
Everything the machine can report, and everything you can safely do to it, goes through one HTTP interface running on the machine itself: faults, live data, configuration, operations, the software on it. After that every tool is a client, from your terminal to the test station to your AI agent. None holds the record, so none has to be rebuilt when the next one arrives, and none is the reason two teams disagree.
Cars got here first, and it took them decades
OBD is why any garage in Europe can read a fault memory over a standard connector, and underneath it UDS, ISO 14229, has done the deep work for years. Both diagnose a unit, where hardware and software are one indivisible thing. Then vehicles became a few powerful computers running service-oriented software updated over the air, where the hardware can be in perfect health while one application on it is not.
| OBD | UDS (ISO 14229) | SOVD (ISO 17978-3) | |
|---|---|---|---|
| Built for | emissions compliance | an ECU sitting on a bus | computers running service-oriented software |
| Speaks | one connector, common codes | request and response over CAN or DoIP | HTTP, against an entity tree |
| Diagnoses | the unit | the unit | the hardware and the software on it, separately |
| Relationship | still there | still the workhorse | reaches a classic ECU through an adapter, replaces nothing |
The third row is the one that matters. A Component is hardware, software, or the two combined, an App is an application executed on a Component, and the tree records which app runs where. That split is what lets anyone ask the question this article opens with.
It is also why it fits a robot. A robot is not an ECU on a CAN bus but a computer running service-oriented software updated in the field, so it is the machine SOVD was designed for, and it arrived without the decades of diagnostic groundwork that came before.
Production made the same move on purpose: Softing sells an end-of-line update and test system, DSA has a line called Flash Programming and Coding in Production. Nothing like it exists on a factory floor. That is the gap Medkit fills, an open-source diagnostic layer that puts robots and controllers in one tree, behind one API.
One interface, carried forward
On the bench
Start it next to the stack you already run and failures that were log lines become structured
faults, with no code changes: /rosout logs and aborted action goals out of the box, REP-107
/diagnostics when you switch that bridge on, and a PLC's alarms through the OPC UA plugin with
nothing installed on the controller. Repeated noise is filtered, so what reaches you is not every
flicker on the way there.
curl localhost:8080/api/v1/apps/planner/faults
# code, owner, severity, a status with a lifecycle,
# a freeze-frame and a recording of the seconds around it
Then there is the class of failure that logs nothing at all, which is where a bench pays for
itself. The graph_watchdog plugin watches the live ROS 2 graph for three of them:
- a QoS mismatch, where two endpoints never connect
- a topic published on one side and subscribed under a near-identical name on the other, which is what a typo looks like
- a parameter that drifted from its commissioned value
ros2doctor reports a QoS mismatch if you ask it, once, and rqt_graph colours one in while the
window is open. Neither is watching at three in the morning, and neither produces a fault that
somebody owns.
At end of line
Nothing new to install, because it went into the image on day one. The station configures the unit, runs the sequence and reads the result back over the same interface:
curl -X PUT localhost:8080/api/v1/apps/planner/configurations/max_speed -d '{"data":1.2}'
curl -X POST localhost:8080/api/v1/components/robot/scripts/eol_test/executions
If your variant lives in node parameters, coding a machine is an HTTP call instead of a custom
script, and /scripts runs the sequence as a real subprocess with a timeout and an execution
record that belongs to the machine rather than to the station. Writing stays gated, the way it is
in cars: /updates gives you the update lifecycle through one endpoint, and the component that
writes your firmware plugs in underneath it, so the keys stay yours.
In the field
The machine ships with the layer already inside it. Faults live on it in SQLite and survive a reboot, a lost link and the shift change, so you read them later, on purpose, the way you read a fault memory. The recording captured at the moment of failure means an intermittent fault arrives with evidence instead of a customer describing a stopped machine.
The end-of-line result and the field failure are finally two records of the same kind, about the same serial number.
The machine holds the record about itself
In the usual setup the machine produces data and something else keeps the record: you model your machines in a database, build the pipeline that fills it, and keep the two in step every time a machine changes. Then somebody asks what is wrong with unit 12. They are not asking unit 12, they are asking your database what it heard last.
Here the machine keeps that record: its own entity tree, its nameplate with manufacturer, model,
serial number and firmware version, and the faults it has right now. It also documents itself. Add
/docs to any path and it writes the OpenAPI spec for that path on the spot, from the topics and
operations it currently has:
curl localhost:8080/api/v1/apps/planner/docs
# an OpenAPI 3.1 document for this app, generated now
So a tool or an AI agent can discover a machine it has never seen before and drive it correctly, with no vendor SDK and nothing hard-coded about that model. On a mixed line that is the difference between one integration and five.
Nothing is uploaded: no telemetry, no licence check, no call home, and authentication on local keys. The gateway needs no outbound connectivity, so it runs on-premises or air-gapped, and recordings stay on the disk that wrote them.
Install it on day one, and know where the open layer ends
Medkit is Apache 2.0, with no device cap, no seat count and no telemetry, and for one machine it is the whole answer.
docker run --rm --network host --ipc host \
  -e ROS_DOMAIN_ID="${ROS_DOMAIN_ID:-0}" \
  -e RMW_IMPLEMENTATION="${RMW_IMPLEMENTATION:-rmw_fastrtps_cpp}" \
  ghcr.io/selfpatch/ros2_medkit-jazzy:latest \
  ros2 launch ros2_medkit_gateway bringup.launch.py
# REST API live at http://localhost:8080/api/v1/
Match your ROS distribution, RMW and ROS_DOMAIN_ID or you will see an empty graph; :latest is
amd64, so use a release tag on arm64. It is in the ROS index for Humble, Jazzy and Lyrical too, so
sudo apt install ros-$ROS_DISTRO-ros2-medkit-gateway works once your distro is sourced.
Day one matters because of an asymmetry: the robot side runs on the machine, so it has to be in the image, and a machine that shipped without it cannot be fitted later without going back to whoever built it. The controller side is the opposite, since the OPC UA plugin connects outward and installs nothing on the PLC.
Three moments then change the problem:
- one machine becomes a fleet
- one middleware becomes robots next to PLCs and ECUs
- having the evidence stops being enough, because somebody has to act on it
That is Medkit Pro: a common view across machines, correlation between them, diagnosis that ranks causes from symptoms and says whether this one points at hardware or software, signed updates with rollback gated on the diagnostic layer, and bridges into the closed protocols.
Sources
- ISO 17978-3:2026, Road vehicles - Service-oriented vehicle diagnostics (SOVD) - Part 3: Application programming interface (API). Defines Component as hardware, software or a combination (ECU, HPC, OS) and App as an application executed on a Component. Classic protocols are reached through an adapter, in UDS, ISO 14229.
- Source, fault model, OPC UA plugin and provider interfaces: github.com/selfpatch/ros2_medkit, docs
- End of line as a purchased diagnostic category: Softing, and DSA's Flash Programming and Coding in Production line
- The manual ROS 2 graph checks that exist today:
ros2doctor,rqt_graph - Related: SOVD for ROS 2, unified PLC and ROS 2 diagnostics